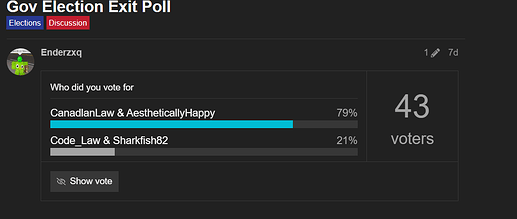
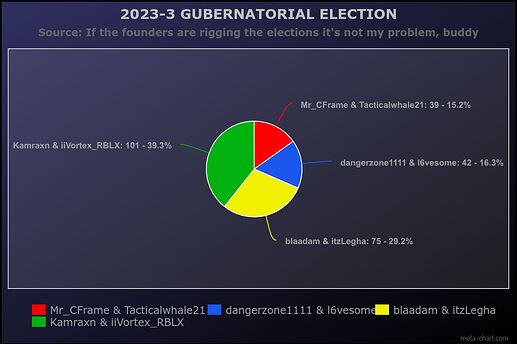
All politics nerds assemble for this “HUGE” amount of data we need to sift through to understand what just happened in our most recent election for the “highest” executive in the land. I don’t know how to tag shit so this is probably in the wrong place on the forum but I think this is my first ever post so whatever, cry about it.
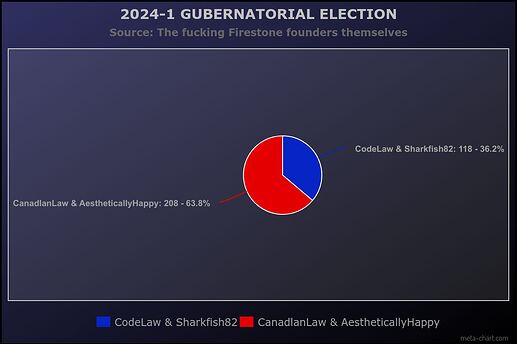
As you can see, there isn’t a lot of data. This was really an excuse to make a shitty pie chart using a shitty website to visualize the election. It’s also a bit boring because only two candidates qualified (and it was almost an auto win for one of them…) but there’s still some data to sift through.
Hard-hitting “Analysis”:
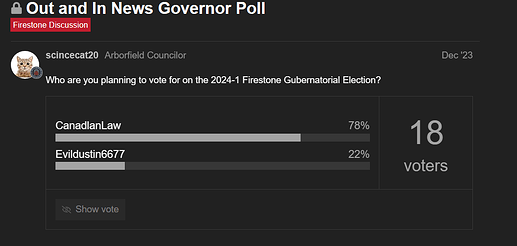
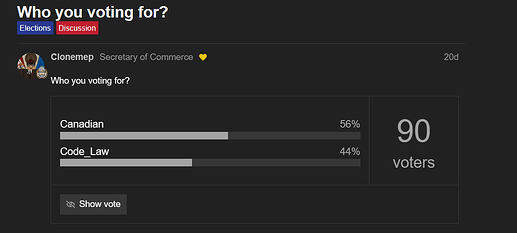
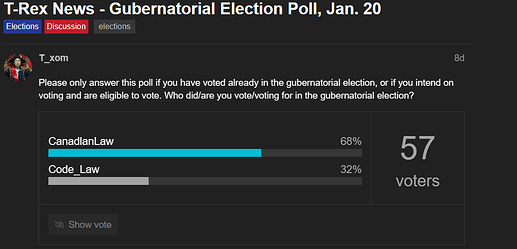
Comparisons between most of the Gubernatorial election polls and the final result:
(KEY: Poll as expressed by lead in percentage points / difference between poll and final result)
December 26th, 2023 poll (Canadian +56, ![]() +28 from final result)
+28 from final result)
January 9th, 2024 poll (Canadian +12 / : ![]() -16 from final result)
-16 from final result)
January 20th, 2024 poll (Canadian +36 / ![]() +8 from final result)
+8 from final result)
January 21st, 2024 poll (exit poll) (Canadian +58 / ![]() +30 from final result)
+30 from final result)
Overall Turnout for 2024-1: 326 votes casted ( ![]() +69
+69 ![]() from previous gubernatorial election, 2023-3)
from previous gubernatorial election, 2023-3)
Average lead of EVERY POLL: Canadian +41
FINAL RESULT: Canadian +28 / ![]() -13 from average lead in all polling)
-13 from average lead in all polling)
Conclusion: Canadian’s lead was insurmountable and almost ran uncontested for Governor because of it, but surprisingly did notably worse than the polling average. You can pretty much chalk that up to a) some of the polls having horrific sample sizes (sorry scincecat) and b) theres a non-insignificant part of the electorate that can vote for Governor but don’t have an account on or don’t use the forum to vote in the many-polls put up before the election. Any other conclusion is probably wrong, though if the election was more competitive it could be comforting to some candidates that losing in these polls with hilariously wild margins of error could mean that you have a chance…
COMPARISON TO THE PREVIOUS GUBERNATORIAL ELECTION (2023-3):
Raw vote total for the winner: Kamraxn with 101 (![]() -107 from 2024-1)
-107 from 2024-1)
Percentage of vote won by the winner: Kamraxn won with 39% of the total vote
(![]() -25% of the electorate won by the winner in 2024-1)
-25% of the electorate won by the winner in 2024-1)
Margin of victory above 2nd place candidate:
Kamraxn +10 / ![]() -18 compared to Margin of Victory for the winner of 2024-1)
-18 compared to Margin of Victory for the winner of 2024-1)
Overall Turnout for 2023-3: 257 votes casted ( ![]() -69
-69 ![]() compared to 2024-1)
compared to 2024-1)
Conclusion: I know it’s been discussed and it’s probably never being changed but damn First-Past-The-Post really screwed things up here in a low turnout but highly competitive election. If we could somehow use some form of ranked choice voting, I wonder what would have happened. Perhaps we could have been saved the trouble for what was to come…
FUN FACTS
Canadian’s margin of victory by 28 percentage points would be the largest margin of victory of popular vote in the history of American presidential elections since the expansion of suffrage in the 1820s. Canadian’s percentage of the vote won (~64%) would also break the record for largest percentage of the total popular vote ever since that time period, breaking Lyndon B. Johnson’s 61% of the popular vote record in the modern era.
Alright yap session over. No, I don’t give a shit if the methodology is wrong (![]() ), or if I put in data wrong, or I misspellllled something. Once again, cry about it.
), or if I put in data wrong, or I misspellllled something. Once again, cry about it.
